

|
|
|
|
|
|
|
|
|
||
|
|
Big Picture
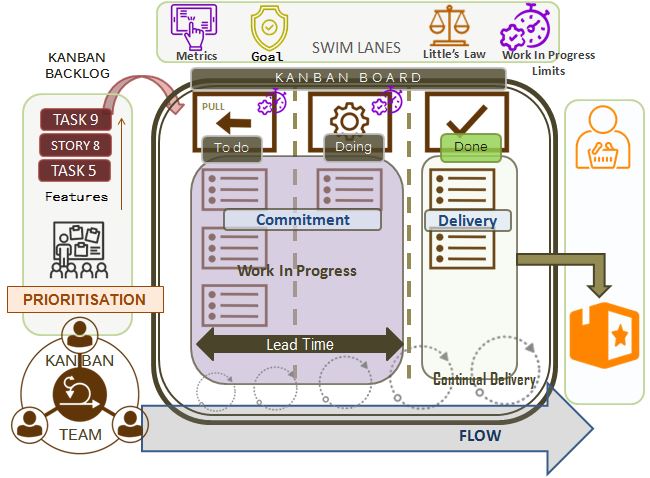
Kanban Board
The visualisation of the flow is a lean approach that helps teams know what tasks or jobs are being completed from a particular process flow. Process sub-tasks are shown in swimlanes, as a sub-task move from left to right the transition in the process is reflected. This enables teams to visualise the work being done, the rate and whether it has been completed or not based on this we can gain metrics where we can improve the efficiency and predictability of a process. A typical Kanban board is illustrated below:
To Do [4]
As a User
I want Yield calculated to Months So that calculation is correct
As a Business Owner
I want a text box to input DOB So that I can submit age
As a Business Owner
I want button So that the age can be calculated Doing [3]
As a Developer
I want to add an index So that consumer query does not time out
As a Technical Architect
I want to install veracode So that developers can check code In Test [4]
As a Business Analyst
I want to see all country codes So that I can map these to the data Done
As a developer
I want to validate the test cases So that QA can start test Work In Progress (WIP) Limits
Kanban takes an approach to limit the number of items that can be worked on at any given stage, this is to ensure a developer or a tester will not be taking on too many tasks and be a bottleneck in the process.
Pull mechanism
The Kanban is a pull system pulling items from left to right, by setting work in progress (WIP) limits forces a 'pull' once there is capacity to feed in another task, this enables the kanban system with a flow mechanism. More importantly new tasks are not started until the tasks are completed.
The main objective to Kanban is not only to achieve good flow but also increase predictability by reducing delays which are often seen as a bottleneck to delivery, so the method allows an
pro-active approach and configure the delivery rate. Scrum and Kanban work really well in managing the flow within work being completed.
Kanban Cards
Kanban card are visual cards that are placed on the board, these can be post-its or simple cards, from an agile perspective it's useful structuring these in terms of the user-story related tasks. Its also useful placing any acceptance criteria at the back of the card so the developer or tester can see the associated conditions.
The cards are then moved across the board based on the workflow stages and are amended by the team accordingly.
Kanban Principles
Kanban has 6 main principles asociated to it, this forms the shape of the flow:
4. Make policies explicit
All process policies around the Kanban should be transparent and fully understood. A good example of this is WIP limits which are clearly defined and published.
5. Implement Feedback loops There are meeting ceremonies in Kanban such as Daily Stand-ups where the entire Kanban teams stand round and discuss items on the board. There are also review meetings to discuss impediments or how to improve the efficiency and flow for some processes.
6. Improve collaboratively / improve iteratively
Large queues are identified as bottlenecks when left idle by Managing Queue lengths we can reduce the lead times, reduce the risk of work being completed and improve quality using Kanban metrics and an Cumulative Flow Diagram. Kanban Core Values
There are nine core values to Kanban
Kanban Metrics
The power of Kanban is the qualitative nature of it, there is clear analytics that can be driven from a Kanban board, it is important there is not too much work in the system. There are four main metrics in a Kanban board:
1. Work In Progress (WIP) These are the items in the Kanban swimlane that have started but not yet completed. The Work In Progress can be limited (or WIP limit), the objective is to limit the number of items the Kanban team can work on concurrently so the items will flow through the system faster. This is based on Queueing Theory. The danger for not setting WIP limits the Kanban team can get overloaded with tasks and become a bottleneck in the workflow, so managing the queues are so important. 2. Cycle Time This also referred to as Lead time or Waiting time. This is the time taken for a task started in the workflow to when it completes at the end of the workflow. In simple terms the cycle time for the 100M sprint is about 10 seconds. The cycle time is important in terms of calculating the efficiency of a task in Kanban, if the cycle time increases we could assume if no factors had changed we are experiencing innefficieny in the process. 3. Work Item age This is the age or time of a work item that has started to the current time and day. if a work Item has started and the cycle time is 2 days, if the work item age is 3 days then we know the item age exceeds the cycle time. 4. Throughput Number of task items finished or done per unit time. This is also known as the throughput rate.
Little's Law
Little's Law can be applied to Kanban which states that the average number of customers in a stable system is equal to the average arrival rate multiplied by the average time that a customer spends in the system. Using the three variables we can associate these to the Kanban metrics
Average Customers = average arrival rate x customer spends in the system
Each Kanban stage is shown cumulatively as an area map so that the visual comparisons can be made regarding the resources and efficiency related to the tasks being completed. Average WIP = Cycle time x Throughput
Re-arranging the formulae using algebra we can use Littles Law to calculate the Throughput
Throughput = Average WIP / Cycle timeCycle time = Average WIP / ThroughputCumulative Flow Diagram (CFD)
A Cumulative Flow Diagram is based on queueing theory and can be used to control the flow of the Kanban process. It is a sophisticated visual tool that is made up of an area graph each detailing the quantity of work that resides in workflows for a given state. The four main variables are
1. Arrivals
2. Cycle time (time in queue) 3. Quantity in Queue 4. Departure
Each Kanban stage is shown cumulatively as an area map so that the visual comparisons can be made regarding the resources and efficiency related to the tasks being completed. The y-axis contains the tasks or storypoints and the x-axis the duration. Each band of the CFD is shown for each part of the Kanban swim lane, the area graph always moves upwards to depict the tasks being completed, the graph should never go down.
This is illustrated below:
Cumulative Insights
The following analytics are illustrated from the CFD diagram
|

|
Contact Vas Rabani for any comments on the website or queries |